Tabular AI Guide
Tabular AI predicts a category or number from rows in a spreadsheet. It is a good fit for churn, lead conversion, risk triage, quality estimates and other problems where each row is one case and each column is a measured attribute.
AnyLearning keeps the source table local, preserves its checksum and trains a native CatBoost model on CPU. Numeric and categorical columns can be mixed; you do not need to one-hot encode them first.
What runs locally
| Workflow | Trainable model | Supporting engine |
|---|---|---|
| Classification | CatBoost classifier | DuckDB + Parquet for bounded table scans |
| Regression | CatBoost regressor | DuckDB + Parquet for bounded table scans |
DuckDB is the data engine, not the prediction model. Every training report also compares CatBoost with a simple held-out baseline so a run is not presented as useful merely because it finished.
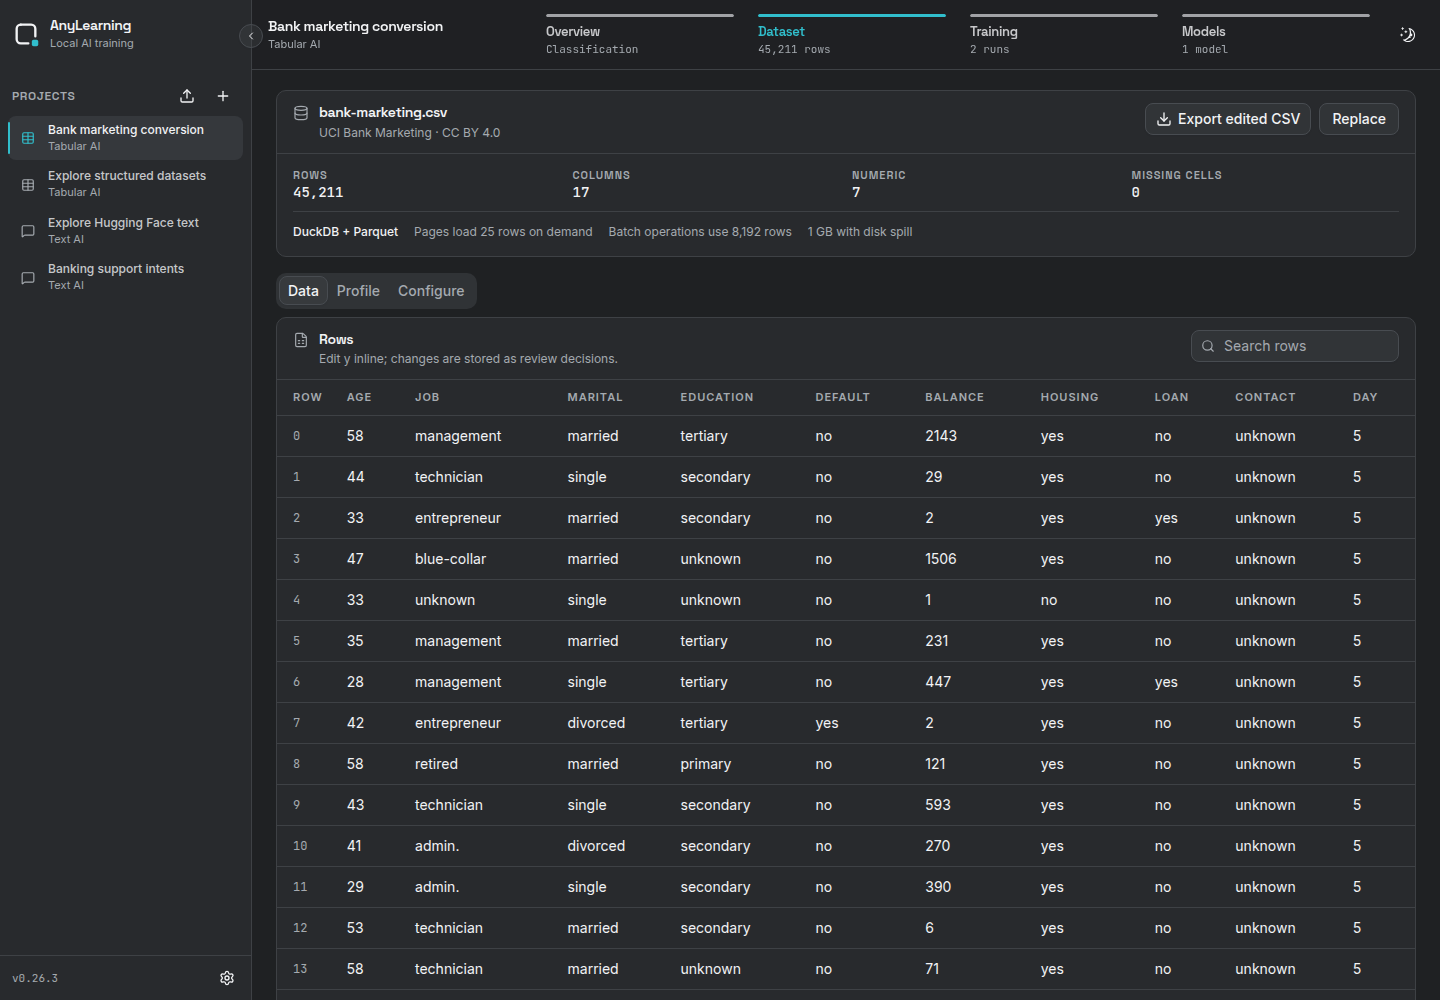
Step 1: Create a Tabular AI project
- Click Create project.
- Choose Tabular AI.
- Open Dataset.
You can upload CSV, TSV, Excel, Parquet or JSON Lines. AnyLearning stores the original file and a canonical Parquet snapshot, then shows missing values, types, cardinality, examples and numeric ranges before training.
CSV, TSV, JSON Lines and Parquet are converted out of core. The table requests only the current 25-row page, filters in the Parquet scan and keeps stable source row IDs for edits. For datasets above 100,000 rows, the row count stays exact while column statistics are explicitly marked as estimates from a deterministic 100,000-row sample. Excel workbooks are the exception: the Excel format requires loading the workbook, so use CSV or Parquet for very large tables.
Table scans use DuckDB's Parquet filter and projection pushdown (opens in a new tab) under its MIT licence (opens in a new tab), with a 1 GB memory ceiling and disk spill into the AnyLearning data directory. This is a ceiling, not a reservation; a normal page uses far less. The UI requests only the ten displayed columns and the current page.
The scale acceptance test uses the real UCI Covertype (opens in a new tab) dataset (CC BY 4.0): 581,012 rows and 55 columns. It passed import and sampled profiling, a 25-row page starting at row 580,000, final-row editing, a 71.69 MB edited CSV export, and bounded CatBoost training on 363,636 sampled rows. On the Linux test machine the deep page took 0.279 seconds and the streamed export took 3.304 seconds; timings vary with disk and CPU.
Step 2: Start with a real example
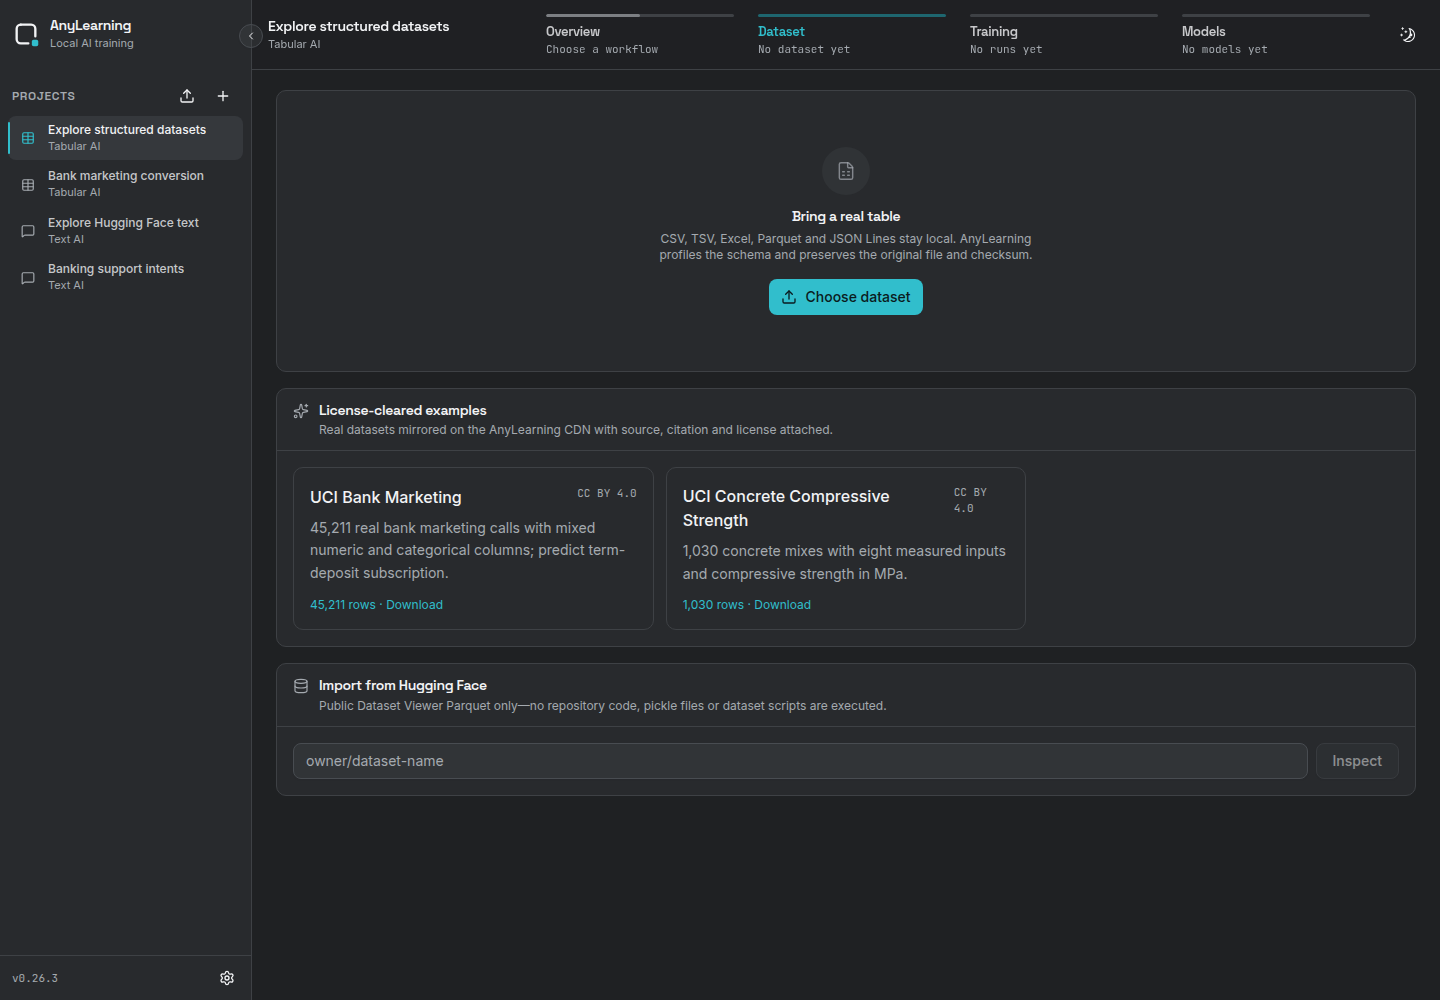
The Dataset page offers two license-cleared downloads:
| Example | Rows | Task | Licence |
|---|---|---|---|
| UCI Bank Marketing (opens in a new tab) | 45,211 | Classification | CC BY 4.0 |
| UCI Concrete Compressive Strength (opens in a new tab) | 1,030 | Regression | CC BY 4.0 |
Clicking an example downloads a fixed file from the AnyLearning CDN, verifies its SHA-256 checksum and configures the target automatically. Source, citation and licence metadata stay in the project archive.
You can also paste a public Hugging Face dataset ID. AnyLearning first shows the dataset card licence, subsets and splits. It imports only the Hub's converted Parquet files: it does not execute dataset scripts or load pickle files. Snapshots are capped at 200,000 rows and 2 GB.
Step 3: Configure the prediction
Choose:
- Classification when the target is a category such as
yesorno. - Regression when the target is a number such as strength in MPa.
- Target column, the value the model should learn to predict.
- Row identifier for an ID that should stay visible but never become a feature.
- Feature columns to exclude IDs, post-outcome fields and unavailable inputs.
- Primary metric: balanced accuracy or macro F1 emphasizes rare classes; accuracy suits balanced class costs; RMSE, MAE and R² serve regression goals.
- Class weighting to balance rare classes or preserve observed frequency.
- Validation and held-out test percentages, plus the reproducible random seed.
The default is a deterministic 70/15/15 split with seed 42, but the contract is now editable and saved with every run. Nearly unique columns are flagged for a leakage check. Keep outcome-derived columns out of the features: a model that sees information created after the decision has data leakage, not high quality.
Step 4: Train and compare with a baseline
Open Training, click Start training, and choose the balanced CatBoost variant. A first run of 200 iterations and learning rate 0.05 is a useful starting point on these examples.
Training is bounded to 500,000 rows and a 20-million-cell memory budget. When a dataset is larger or very wide, AnyLearning takes a reproducible reservoir sample and records both the full dataset size and training sample size in the model report. Validation and test rows come from that saved sample. Smart Review considers at most 100,000 candidates, which prevents duplicate and uncertainty analysis from growing without limit.
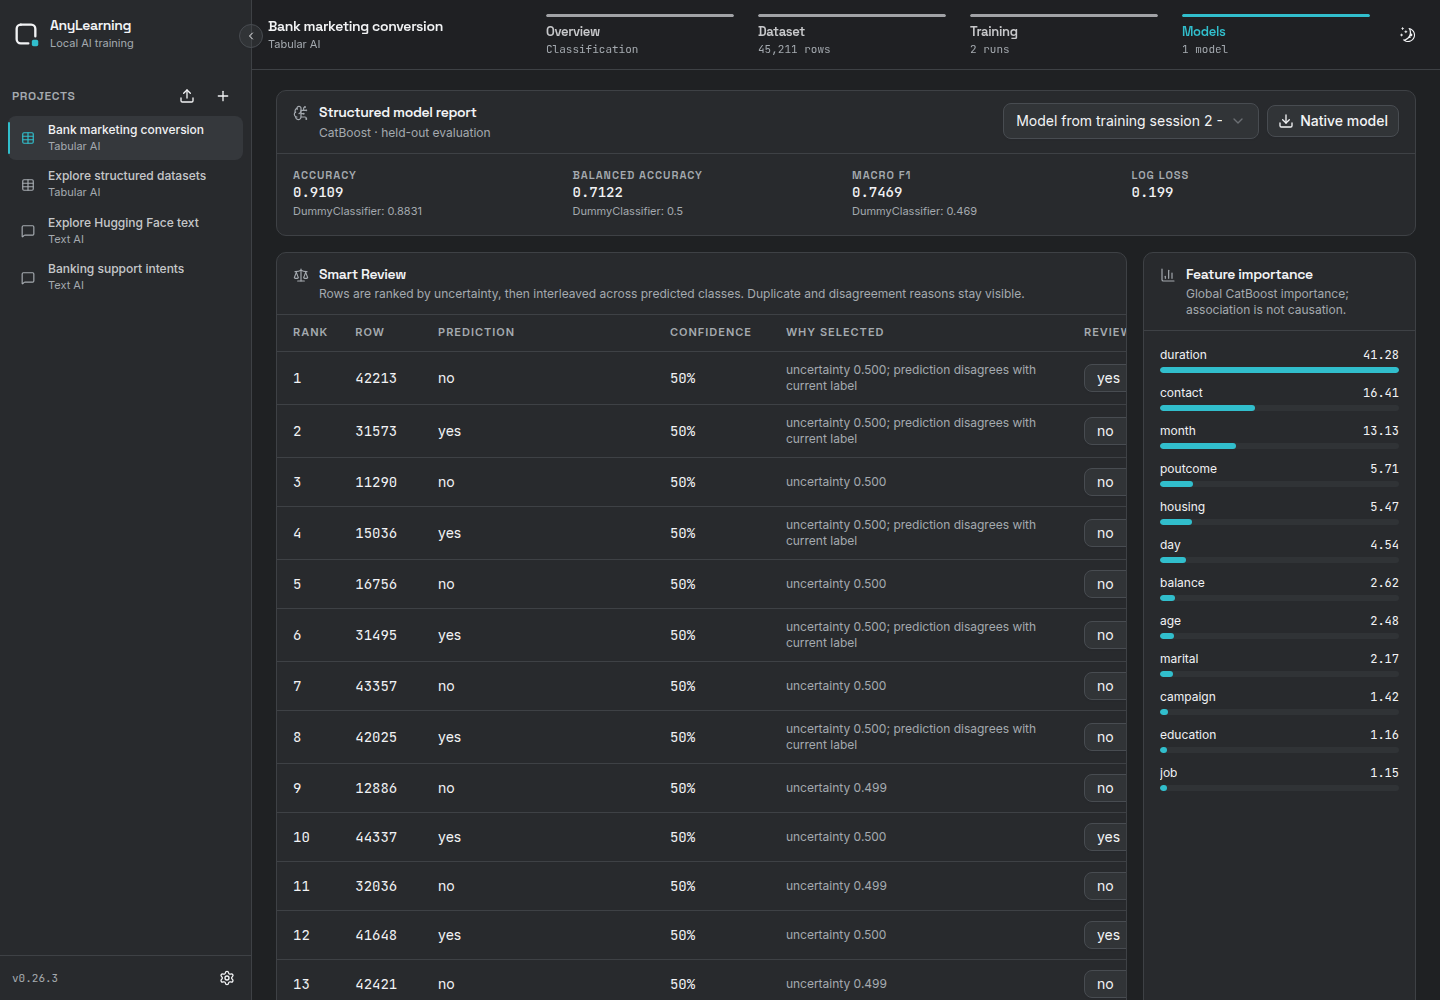
Every report puts the chosen primary metric first and includes supporting held-out metrics, a deliberately simple baseline, per-class precision, recall and F1, and a confusion matrix for manageable class counts. A model is useful only when it improves on that baseline. These are reproduced results from the published examples, using the saved seed-42 split:
| Dataset | Held-out model | Baseline |
|---|---|---|
| Bank Marketing | Macro F1 0.7469 | 0.4690 |
| Concrete Strength | R² 0.9021 | −0.0023 |
The Models page also shows feature importance. Treat it as a model diagnostic, not proof that a feature causes the outcome.
Step 5: Review uncertain rows
Smart Review ranks rows the classifier is least confident about, then interleaves predicted classes so one common class does not fill the queue. It also flags duplicate feature rows and prediction/label disagreements. For regression, the queue uses normalized residual error.
The report includes a seeded random queue as a comparison. This makes active learning measurable: correct a bounded review batch, retrain, and compare its held-out improvement with the same number of randomly selected corrections.
Edit a target value inline when the source label is wrong. The edit is stored as a review decision and used by the next run; the original source file remains unchanged.
Step 6: Predict and export
Paste one or more JSON rows in Models → Try rows. Required feature names are validated and classification output includes confidence and per-class scores.
Download Raw Model for the native CatBoost artifact. The project export contains the original source, canonical rows, review overrides, task configuration, attribution and checksum. Mixed categorical CatBoost models do not offer an ONNX button because silently changing their preprocessing would make the exported model misleading.
CSV export is also streamed in batches when review overrides exist; without edits DuckDB writes it directly from Parquet. A training run references the project Parquet instead of making another full-size copy in its run directory.